Posts

Showing posts from June, 2019

Analyzing Text and Sentiment Analysis in R: Amazon Product Review Example

Image
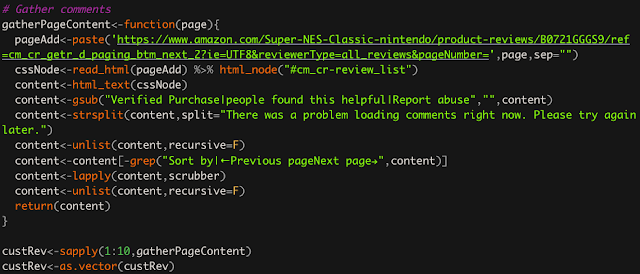
Data analysts don't always have the luxury of having numerical data to analyze. Many times data comes in the form of open text. For example, consumer product reviews or feedback, and comment threads through online merchants or CRM (customer relationship management, e.g. salesforce) portals can all be open text. It's no simple task turning open text into usable information. Word clouds are one way of approaching this task by highlighting superlative terms. There are a number of word cloud libraries in R, my favorite being "wordcloud2". It outputs an html document that allows you to hover over cloud terms to see its frequency. I mention this because word clouds are so common, however, I won't be spending any more time on this post about them. In this post I'll be discussing the following: A very brief discussion about extracting online data using 'rvest'. Basic options for cleaning text data. The polarity function from the qdap package. We live

Network Analysis in R: Visualizing Network Dynamics

Image
Network analysis is just a moniker for graphically describing network relationships. Whether you are a health official trying to describe the spread of communicable diseases or a business analyst describing the progress of a sales campaign or incentive, network analysis helps others view and better understand a network dynamic. You will need to download the 'network' package for this. In this post I will be doing the following: Provide a simple made up example to understand what network analysis is. Expand upon the simple example by adding hyper edges, different shapes and colors, and changing labels for vertices and edges to convey additional information. Provide R code with explanations of how to generate these graphics. Let's begin with a quick example so it is clear what network analysis is. At its simplest, a network analysis is a graphical depiction of the movement of some unit among various entities. In the above graphic, I have nine entities with the arr

Online Statistics Tutor: Introduction to Hypothesis Testing - Understanding and Interpreting Statistical Hypothesis Tests

Image
Regardless of the statistical test that you are using, the process of rejecting or retaining a null hypothesis can be confusing for many. I'm not going to target any one hypothesis test, rather discuss the general logic. My intention with this post is to provide students of introductory statistics courses (or anyone attempting to learn these concepts) some additional insight into how to understand and interpret hypothesis tests. Whether you are conducting a t-test, F-test, chi-square, or are testing regression coefficients from a model, the general idea behind it all is the same. All statistical hypothesis tests follow the same general approach of testing the scenario of the null hypothesis. That is, there is no association or detectable effect with your outcome variable, also known as the dependent variable. The alternative hypothesis is usually the research hypothesis, e.g. soda affects obesity, or excessive exposure to business meetings is associated with reduced brain funct

Online Statistics Tutor: Normal Confidence Intervals - Beginnings of Statistical Uncertainty

Image
This online statistics tutor lesson is intended to supplement introductory statistics material as additional instruction and review. In this lesson we will only be covering beginning concepts regarding confidence intervals around an estimated mean. Estimating confidence intervals uses essentially the same principles and concepts used for calculating z-scores and normal probabilities (at least for CIs for means estimated from normal data). If you need a refresher regarding these concepts, check out one of my other posts . Uncertainty in Research and Statistics Though many are reluctant to admit it, there is a great deal of uncertainty in the information that we consume. Information sources (including legitimate sources) boast new conclusions about the world around us from healthy eating and everyday behavior to climate change and astrophysics. Something that many media sources often glaze over is that NONE of them are 100% sure about their hypothesized conclusion . These conclusion

R, Shiny, Rmarkdown Dashboard Tutorial with Cryptocurrency Data Example

Image
This post is intended for those with some exposure to R and shiny. If you are brand new to Shiny or Rmarkdown, then you may want to review this post before proceeding onward. I'll address the following: Loading and using data in your document Adjusting margins in your shiny document. Margins are by default set at a specific width for all shiny documents. Provide example code for R, Rshiny, Rmarkdown dashboard. Includes two selector inputs, one to choose which column of the daily trading data to use and the other to select which cryptocurrencies to plot. date range input render table with correlation matrix render line graph with options to select which cryptocurrencies to graph. On my last post I gave an explanation of the tutorial code that appears when you open a new Rmarkdown document. This time I built a small dashboard with online cryptocurrency trading data. I pulled this data from this webpage which has all sorts of cyrpto trading data. I used the three daily

Beginner Tutorial for Dashboard / Web Development Using R, Shiny, R Markdown.

Image
Creating dashboards is an excellent way to present dynamic and actionable analytic output. There is a plethora of proprietary dashboard software packages but they cost exorbitant amounts to do something that isn't as powerful or flexible as R shiny, which is freely available. Admittedly, many of these software packages provide data / database integration and other bells and whistles, but you can accomplish the same things with a little know how. My hope is to enable people to produce their desired and perhaps needed dashboard free of cost (other than man hours) without having to commit to a third party vendor. I'll be covering basics here, but if people are also interested in more advanced features such as interactive plots, I can write another tutorial going over that. I use R Markdown because I find using two R files, one for the UI and the other for the R code (server file) is terribly obnoxious and a bit cumbersome. R Markdown allows you to do it all in one .rmd file. R