Posts

Showing posts with the label Statistics

Learn to Code in R: Introduction to R and Basic Concepts.
Image
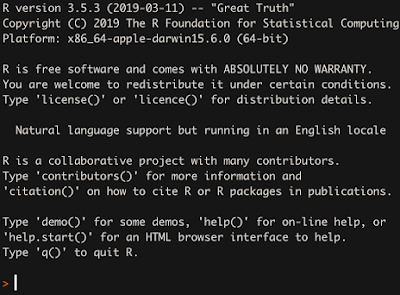
There are many options when it comes to statistical computing, but R is freely available, powerful, robust, and always getting better. Most statistical software packages have exorbitant costs associated with obtaining personal or group licenses. But with R, you get an extremely powerful software package that is just as good, if not better, for no cost! This software is ever-improving and growing thanks to the many people who contribute to this project and make this all possible. This post is designed to be a first time exposure to R for those with no experience and want to start learning how to code. Whether you are a student in a stats course trying to learn or are trying to acquire a little R know-how in order to expand you business intelligence skills, this post is designed to help people get started. In this post, I will be giving you a basic knowledge of R skills so you can start doing simple analyses quickly. Specifically, I will be covering How to acquire R and Rstudio. Rs

Online Statistics Tutor: Introduction to Hypothesis Testing - Understanding and Interpreting Statistical Hypothesis Tests

Image
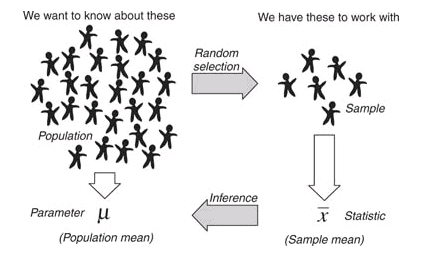
Regardless of the statistical test that you are using, the process of rejecting or retaining a null hypothesis can be confusing for many. I'm not going to target any one hypothesis test, rather discuss the general logic. My intention with this post is to provide students of introductory statistics courses (or anyone attempting to learn these concepts) some additional insight into how to understand and interpret hypothesis tests. Whether you are conducting a t-test, F-test, chi-square, or are testing regression coefficients from a model, the general idea behind it all is the same. All statistical hypothesis tests follow the same general approach of testing the scenario of the null hypothesis. That is, there is no association or detectable effect with your outcome variable, also known as the dependent variable. The alternative hypothesis is usually the research hypothesis, e.g. soda affects obesity, or excessive exposure to business meetings is associated with reduced brain funct

Online Statistics Tutor: Normal Confidence Intervals - Beginnings of Statistical Uncertainty

Image
This online statistics tutor lesson is intended to supplement introductory statistics material as additional instruction and review. In this lesson we will only be covering beginning concepts regarding confidence intervals around an estimated mean. Estimating confidence intervals uses essentially the same principles and concepts used for calculating z-scores and normal probabilities (at least for CIs for means estimated from normal data). If you need a refresher regarding these concepts, check out one of my other posts . Uncertainty in Research and Statistics Though many are reluctant to admit it, there is a great deal of uncertainty in the information that we consume. Information sources (including legitimate sources) boast new conclusions about the world around us from healthy eating and everyday behavior to climate change and astrophysics. Something that many media sources often glaze over is that NONE of them are 100% sure about their hypothesized conclusion . These conclusion

Online Statistics Tutor: Z-scores & Normal Probabilities

Image
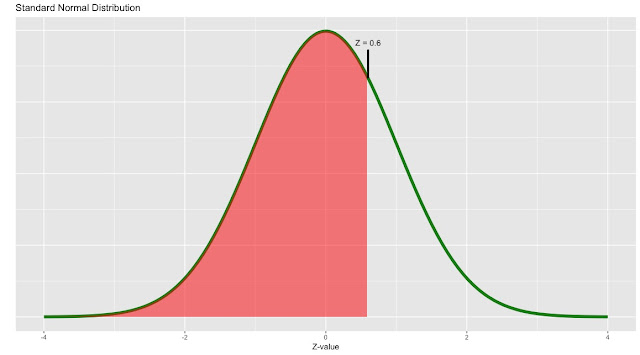
During my days of teaching introductory statistics, students were often looking for additional resources to help them master the material. My hope is for this post to supplement and aid students who are being introduced to statistics, or anyone looking for refresher material. That being said, if there is a specific topic that you would like me to cover that is not found here, please mention this in the comments and I will do my best to produce a lesson for it. Normal Probability Normal probability is referring to making inference (coming to a conclusion and generalizing that conclusion to a population) about the likelihood of an event based upon the assumption the outcome is normally distributed. In short, assume normally distributed data in order to make inference. For example, let's assume human height is normally distributed. How likely is it that a man is over 5 feet 10 inches (70 in)? Let's say the population has a mean of 68 inches with a standard deviation of 4 i