Posts

Showing posts with the label Learn R

Online Statistics Tutor: Linear Regression - Understanding and Interpreting Linear Regression

Image
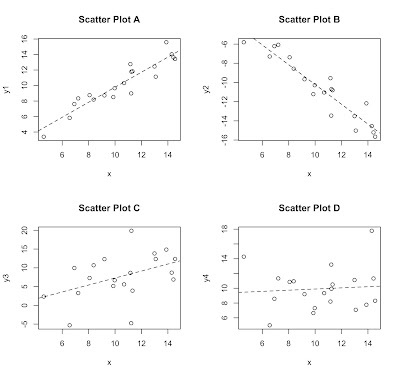
Simple Linear Regression is a staple in every statistical toolbox. The idea is to estimate a linear relationship between a  dependent variable  ( Y  or your outcome) and an  independent variable  ( X  or your predictor variable). That is, we estimate the equation of a line through data points that minimizes the vertical distance of the data points to that line. From this we can better understand how X affects Y. This analysis can be used for predictive purposes, as well. In this post I plan on only addressing some basic principles about regression in order to best understand what it is and how to use it. I will focus on Scatterplots and linear relationships. Point-slope equation for a line and how it works. Estimating slope coefficients. Interpreting the slope. Brief mention of other regression concepts (which I may address in later posts).  Scatterplots and Linear Relationships If you are not already familiar with what a scatterplot is, it is merely a graphical method t

Learn to Code in R: Introduction to R and Basic Concepts.

Image
There are many options when it comes to statistical computing, but R is freely available, powerful, robust, and always getting better. Most statistical software packages have exorbitant costs associated with obtaining personal or group licenses. But with R, you get an extremely powerful software package that is just as good, if not better, for no cost! This software is ever-improving and growing thanks to the many people who contribute to this project and make this all possible. This post is designed to be a first time exposure to R for those with no experience and want to start learning how to code. Whether you are a student in a stats course trying to learn or are trying to acquire a little R know-how in order to expand you business intelligence skills, this post is designed to help people get started. In this post, I will be giving you a basic knowledge of R skills so you can start doing simple analyses quickly. Specifically, I will be covering How to acquire R and Rstudio. Rs

Network Analysis in R: Visualizing Network Dynamics

Image
Network analysis is just a moniker for graphically describing network relationships. Whether you are a health official trying to describe the spread of communicable diseases or a business analyst describing the progress of a sales campaign or incentive, network analysis helps others view and better understand a network dynamic. You will need to download the 'network' package for this. In this post I will be doing the following: Provide a simple made up example to understand what network analysis is. Expand upon the simple example by adding hyper edges, different shapes and colors, and changing labels for vertices and edges to convey additional information. Provide R code with explanations of how to generate these graphics. Let's begin with a quick example so it is clear what network analysis is. At its simplest, a network analysis is a graphical depiction of the movement of some unit among various entities. In the above graphic, I have nine entities with the arr

R, Shiny, Rmarkdown Dashboard Tutorial with Cryptocurrency Data Example

Image
This post is intended for those with some exposure to R and shiny. If you are brand new to Shiny or Rmarkdown, then you may want to review this post before proceeding onward. I'll address the following: Loading and using data in your document Adjusting margins in your shiny document. Margins are by default set at a specific width for all shiny documents. Provide example code for R, Rshiny, Rmarkdown dashboard. Includes two selector inputs, one to choose which column of the daily trading data to use and the other to select which cryptocurrencies to plot. date range input render table with correlation matrix render line graph with options to select which cryptocurrencies to graph. On my last post I gave an explanation of the tutorial code that appears when you open a new Rmarkdown document. This time I built a small dashboard with online cryptocurrency trading data. I pulled this data from this webpage which has all sorts of cyrpto trading data. I used the three daily