Posts

Showing posts with the label Statistical Programming

Learn to Code in R: for Loops and tapply, lapply, and sapply.

Image
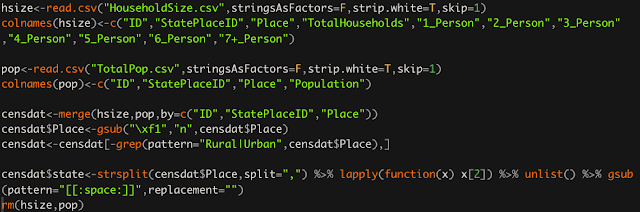
Continuing on with the discussion of for loops and apply functions bring us to another set of apply functions used to, well, apply a function to data in different ways. In this post, I will be: Discussing the arrays or data arrangements for which the different apply functions are designed. That is, when to use each one. Comparing for loops to tapply, lapply, and sapply. I will write for loops for each so you can better familiarize yourself with for loops and situations where you can use the apply functions, instead. The data I will be using for this is the same data set that I used for the apply function post . This is some code I used to prepare the data to get it to its current state. Some of which I will be discussing later. I mostly provide this for the sake of disclosure and clarity. lapply and sapply: Apply a function over a Vector or List This is the most apparent and obvious replacement to a for loop. You give lapply the information set that you wish to iterat

Learn to Code in R: Introduction to R and Basic Concepts.

Image
There are many options when it comes to statistical computing, but R is freely available, powerful, robust, and always getting better. Most statistical software packages have exorbitant costs associated with obtaining personal or group licenses. But with R, you get an extremely powerful software package that is just as good, if not better, for no cost! This software is ever-improving and growing thanks to the many people who contribute to this project and make this all possible. This post is designed to be a first time exposure to R for those with no experience and want to start learning how to code. Whether you are a student in a stats course trying to learn or are trying to acquire a little R know-how in order to expand you business intelligence skills, this post is designed to help people get started. In this post, I will be giving you a basic knowledge of R skills so you can start doing simple analyses quickly. Specifically, I will be covering How to acquire R and Rstudio. Rs

Learn to Code in R: For Loops, and Apply Function.

Image
When analyzing data you often have to iterate through a set of values, or apply the same function to to that set. While R does not have a great reputation for iterative processes, the apply functions are a way around writing a slow for loop. Mastering the use of the apply functions will make your coding much more efficient and versatile. In this post, I will discuss the following: for loops. When and how to use them. I'll also briefly mention while loops. How to use apply . I will address  tapply ,  lapply , and  sapply in a subsequent post. To help demonstrate how the apply function can be used instead of a for loop, I will carry out the same task using both methods. Before I do that, I am going to go over some looping basics for those who may be unfamiliar or may need a review. For Loop Basics A for loop iterates through the elements of a vector (a set of values), where at each iteration will be represented by the object provided in the for statement. One conven

Analyzing Text and Sentiment Analysis in R: Amazon Product Review Example

Image
Data analysts don't always have the luxury of having numerical data to analyze. Many times data comes in the form of open text. For example, consumer product reviews or feedback, and comment threads through online merchants or CRM (customer relationship management, e.g. salesforce) portals can all be open text. It's no simple task turning open text into usable information. Word clouds are one way of approaching this task by highlighting superlative terms. There are a number of word cloud libraries in R, my favorite being "wordcloud2". It outputs an html document that allows you to hover over cloud terms to see its frequency. I mention this because word clouds are so common, however, I won't be spending any more time on this post about them. In this post I'll be discussing the following: A very brief discussion about extracting online data using 'rvest'. Basic options for cleaning text data. The polarity function from the qdap package. We live

Network Analysis in R: Visualizing Network Dynamics

Image
Network analysis is just a moniker for graphically describing network relationships. Whether you are a health official trying to describe the spread of communicable diseases or a business analyst describing the progress of a sales campaign or incentive, network analysis helps others view and better understand a network dynamic. You will need to download the 'network' package for this. In this post I will be doing the following: Provide a simple made up example to understand what network analysis is. Expand upon the simple example by adding hyper edges, different shapes and colors, and changing labels for vertices and edges to convey additional information. Provide R code with explanations of how to generate these graphics. Let's begin with a quick example so it is clear what network analysis is. At its simplest, a network analysis is a graphical depiction of the movement of some unit among various entities. In the above graphic, I have nine entities with the arr

R, Shiny, Rmarkdown Dashboard Tutorial with Cryptocurrency Data Example

Image
This post is intended for those with some exposure to R and shiny. If you are brand new to Shiny or Rmarkdown, then you may want to review this post before proceeding onward. I'll address the following: Loading and using data in your document Adjusting margins in your shiny document. Margins are by default set at a specific width for all shiny documents. Provide example code for R, Rshiny, Rmarkdown dashboard. Includes two selector inputs, one to choose which column of the daily trading data to use and the other to select which cryptocurrencies to plot. date range input render table with correlation matrix render line graph with options to select which cryptocurrencies to graph. On my last post I gave an explanation of the tutorial code that appears when you open a new Rmarkdown document. This time I built a small dashboard with online cryptocurrency trading data. I pulled this data from this webpage which has all sorts of cyrpto trading data. I used the three daily