Posts

Showing posts with the label R

Structural Machine Learning in R: Predicting Probabilistic Offender Profiles using FBI's NIBRS Data
Image
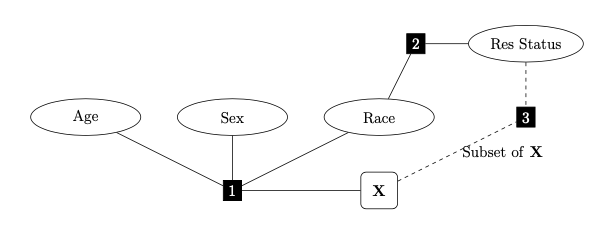
What is Structural Machine Learning? Most machine learning tasks are designed for classifying data, but what if you have multiple outcomes? Not only do you have multiple outcomes (Y's or output variables), but you also need to enforce specific relationships among those outcomes and your predictors (X). Traditional ML can do many things, but this is not one of them. Traditional ML classifiers have one outcome and they attempt to classify that univariate outcome. A genre of machine learning that handles multiple outcomes and allows data scientists to specify a structure among all variables of interest is called "structured prediction". This genre of ML has existed in the literature for many years, but isn't something I've come across much, so I figured I would present a simple form of structured prediction and motivate it with an illustrative example. The Problem I'll motivate this with the idea of criminal profiling. It's an interesting subject and somethin

Two-Step fix for rJava library installation on Mac OS

I've been using R for some time and over the years I've had one consistent nagging problem.  rJava Perhaps the single most temperamental library in the whole history of R. If you are like me, you likely try to avoid anything Java based, like using openxlsx  instead of xlsx . I don't use Java but a number of libraries I do use, have it as a dependency. For example, I like to use qdap because it has a lot of nice tools for qualitative analysis, which of course uses Java. The big problem is that rJava never installs properly and gives some error along the lines of not being able to find jdk files, jni.h, or Java home when you try to call the library. I have a couple quick steps here that can get rJava up and running quickly. I haven't noticed this issue in Windows which means the library is probably written for Windows and the developer hasn't bothered to make it function out-of-the-box on Mac OS. Two quick steps and you can get rJava working in R on Mac OS. Downloa

Integrating Data Management and Data Analytics with R and postgreSQL.

Image
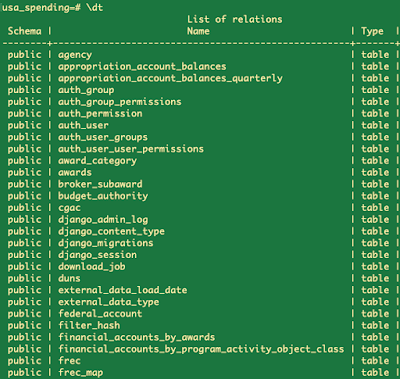
Those wanting to be successful in data analytics increasingly have to become well versed in managing their data. That means it is no longer sufficient to just learn R or an analytic platform. You also need to be competent with SQL or some similar database platform. As I am a huge advocate of open source applications, I will be using postgreSQL although that certainly isn't the only SQL platform that R can work with. I've got R to work with MySQL, Oracle SQL, postgreSQL, and Microsoft Server SQL. I already have a post on how to connect R to these platforms, though I don't get into Microsoft SQL Server because it is a painful (not worth it) process to do this if you are running OSX. ( https://www.lazybayesian.com/2019/05/connecting-r-to-sql-database-postgresql.html)  Y ou would end up using RODBC package or something similar to get it done but you end up needing to use homebrew to install other tools on your machine to even to get that to work, and it just keeps going. If y

Which Game is the Scariest? Alien: Isolation, Dead Space, Dead Space 2, or Silent Hill 2? An R Halloween Analysis!

Image
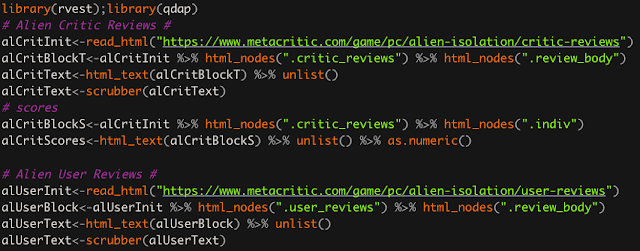
I wanted to get into the halloween spirit by doing some kind of horror themed analytics post. The idea of combining R, data analytics, and the macabre isn't as straightforward as some may think (yes, that was a joke). While I don't care for horror movies, for some reason, I enjoy survival horror video games. Not playing them, of course. I'm far too squeamish for that. I usually watch youtube videos of other people playing them to spare myself a panic attack. I'm the kind of guy who would start playing the game and once the atmosphere became intense, I would just go, "NOPE", turn off the game and walk away. Of the survival horror games I've seen, the Dead Space franchise is up there. I also love the Alien franchise, though that franchise has suffered from a number of awful releases (including movies). Alien: Isolation is a gem, whose intense atmosphere makes every footstep nerve-racking. Lastly, I wanted to include another game that I haven't see

Online Statistics Tutor: Linear Regression - Understanding and Interpreting Linear Regression

Image
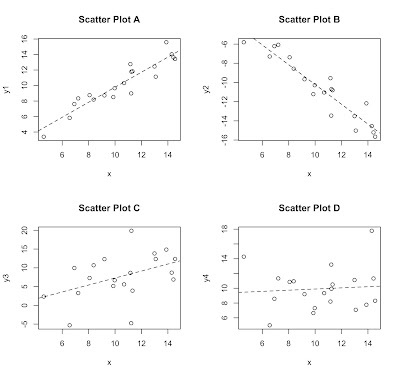
Simple Linear Regression is a staple in every statistical toolbox. The idea is to estimate a linear relationship between a  dependent variable  ( Y  or your outcome) and an  independent variable  ( X  or your predictor variable). That is, we estimate the equation of a line through data points that minimizes the vertical distance of the data points to that line. From this we can better understand how X affects Y. This analysis can be used for predictive purposes, as well. In this post I plan on only addressing some basic principles about regression in order to best understand what it is and how to use it. I will focus on Scatterplots and linear relationships. Point-slope equation for a line and how it works. Estimating slope coefficients. Interpreting the slope. Brief mention of other regression concepts (which I may address in later posts).  Scatterplots and Linear Relationships If you are not already familiar with what a scatterplot is, it is merely a graphical method t

Learn to Code in R: Reading in External Data Files

Image
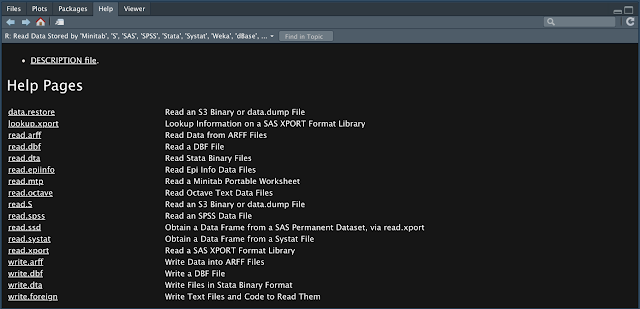
One skill that everyone in R should have is how to read in external data files. Many people who have some exposure to R will have some familiarity with this skill, but little knowledge of the many formats R can handle. This is often because many people's exposure is from a singular class or a project they did once. My hope is to provide the reader with a broader understanding of R's ability to handle a number of data formats. In this post, I will cover, How to read in .csv, Stata, SPSS, SAS, and Excel spreadsheet files. Some formatting options and different abilities you ought to know. Some explanations regarding help documentation and using function arguments/options. Saving and loading Rdata files for minimal hassle once the data is just the way you want it. Reading in Text Files and Function Options The basic function for reading in data is read.table() . I mention this one first because the other functions for reading in external data are based off of this one. In

Online Statistics Tutor: Analyzing Nominal and Ordinal Data

Image
While nominal (categorical) and ordinal (rank order) data can't be used in standard introductory analyses, like  the T or F-tests, there still is a number of options when working with these kinds of data.  In this post I will point out a few of these, specifically, Producing table of counts of cross-tabs.  Chi-square test of association. Kruskall's Gamma: A correlation coefficient for ordinal data. I will provide code on how to perform each in R Let's first start with producing count tables in R. This is the most basic way to summarize nominal or ordinal data. In the code below, I've created a couple sets of nominal and ordinal values containing all available values and then sampled from them. The output from sampling from the set of 4 colors and 5 items in a likert scale are saved as "colset" and "ordset". The size argument in the sample function means that this output will be 100 elements long. To produce a table of counts for these da