Posts

Showing posts from 2019

Which Game is the Scariest? Alien: Isolation, Dead Space, Dead Space 2, or Silent Hill 2? An R Halloween Analysis!
Image
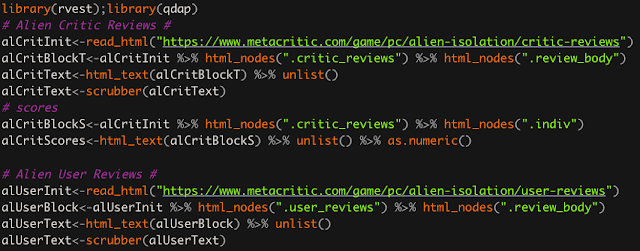
I wanted to get into the halloween spirit by doing some kind of horror themed analytics post. The idea of combining R, data analytics, and the macabre isn't as straightforward as some may think (yes, that was a joke). While I don't care for horror movies, for some reason, I enjoy survival horror video games. Not playing them, of course. I'm far too squeamish for that. I usually watch youtube videos of other people playing them to spare myself a panic attack. I'm the kind of guy who would start playing the game and once the atmosphere became intense, I would just go, "NOPE", turn off the game and walk away. Of the survival horror games I've seen, the Dead Space franchise is up there. I also love the Alien franchise, though that franchise has suffered from a number of awful releases (including movies). Alien: Isolation is a gem, whose intense atmosphere makes every footstep nerve-racking. Lastly, I wanted to include another game that I haven't see

Online Statistics Tutor: Linear Regression - Understanding and Interpreting Linear Regression

Image
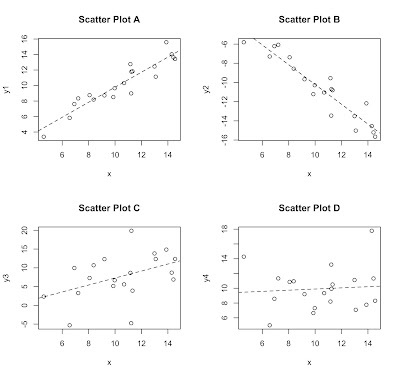
Simple Linear Regression is a staple in every statistical toolbox. The idea is to estimate a linear relationship between a  dependent variable  ( Y  or your outcome) and an  independent variable  ( X  or your predictor variable). That is, we estimate the equation of a line through data points that minimizes the vertical distance of the data points to that line. From this we can better understand how X affects Y. This analysis can be used for predictive purposes, as well. In this post I plan on only addressing some basic principles about regression in order to best understand what it is and how to use it. I will focus on Scatterplots and linear relationships. Point-slope equation for a line and how it works. Estimating slope coefficients. Interpreting the slope. Brief mention of other regression concepts (which I may address in later posts).  Scatterplots and Linear Relationships If you are not already familiar with what a scatterplot is, it is merely a graphical method t

Learn to Code in R: Reading in External Data Files

Image
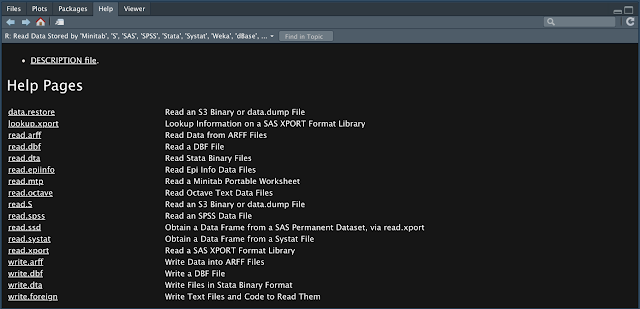
One skill that everyone in R should have is how to read in external data files. Many people who have some exposure to R will have some familiarity with this skill, but little knowledge of the many formats R can handle. This is often because many people's exposure is from a singular class or a project they did once. My hope is to provide the reader with a broader understanding of R's ability to handle a number of data formats. In this post, I will cover, How to read in .csv, Stata, SPSS, SAS, and Excel spreadsheet files. Some formatting options and different abilities you ought to know. Some explanations regarding help documentation and using function arguments/options. Saving and loading Rdata files for minimal hassle once the data is just the way you want it. Reading in Text Files and Function Options The basic function for reading in data is read.table() . I mention this one first because the other functions for reading in external data are based off of this one. In

Online Statistics Tutor: Analyzing Nominal and Ordinal Data

Image
While nominal (categorical) and ordinal (rank order) data can't be used in standard introductory analyses, like  the T or F-tests, there still is a number of options when working with these kinds of data.  In this post I will point out a few of these, specifically, Producing table of counts of cross-tabs.  Chi-square test of association. Kruskall's Gamma: A correlation coefficient for ordinal data. I will provide code on how to perform each in R Let's first start with producing count tables in R. This is the most basic way to summarize nominal or ordinal data. In the code below, I've created a couple sets of nominal and ordinal values containing all available values and then sampled from them. The output from sampling from the set of 4 colors and 5 items in a likert scale are saved as "colset" and "ordset". The size argument in the sample function means that this output will be 100 elements long. To produce a table of counts for these da

Learn to Code in R: for Loops and tapply, lapply, and sapply.

Image
Continuing on with the discussion of for loops and apply functions bring us to another set of apply functions used to, well, apply a function to data in different ways. In this post, I will be: Discussing the arrays or data arrangements for which the different apply functions are designed. That is, when to use each one. Comparing for loops to tapply, lapply, and sapply. I will write for loops for each so you can better familiarize yourself with for loops and situations where you can use the apply functions, instead. The data I will be using for this is the same data set that I used for the apply function post . This is some code I used to prepare the data to get it to its current state. Some of which I will be discussing later. I mostly provide this for the sake of disclosure and clarity. lapply and sapply: Apply a function over a Vector or List This is the most apparent and obvious replacement to a for loop. You give lapply the information set that you wish to iterat

Learn to Code in R: Introduction to R and Basic Concepts.

Image
There are many options when it comes to statistical computing, but R is freely available, powerful, robust, and always getting better. Most statistical software packages have exorbitant costs associated with obtaining personal or group licenses. But with R, you get an extremely powerful software package that is just as good, if not better, for no cost! This software is ever-improving and growing thanks to the many people who contribute to this project and make this all possible. This post is designed to be a first time exposure to R for those with no experience and want to start learning how to code. Whether you are a student in a stats course trying to learn or are trying to acquire a little R know-how in order to expand you business intelligence skills, this post is designed to help people get started. In this post, I will be giving you a basic knowledge of R skills so you can start doing simple analyses quickly. Specifically, I will be covering How to acquire R and Rstudio. Rs

Learn to Code in R: For Loops, and Apply Function.

Image
When analyzing data you often have to iterate through a set of values, or apply the same function to to that set. While R does not have a great reputation for iterative processes, the apply functions are a way around writing a slow for loop. Mastering the use of the apply functions will make your coding much more efficient and versatile. In this post, I will discuss the following: for loops. When and how to use them. I'll also briefly mention while loops. How to use apply . I will address  tapply ,  lapply , and  sapply in a subsequent post. To help demonstrate how the apply function can be used instead of a for loop, I will carry out the same task using both methods. Before I do that, I am going to go over some looping basics for those who may be unfamiliar or may need a review. For Loop Basics A for loop iterates through the elements of a vector (a set of values), where at each iteration will be represented by the object provided in the for statement. One conven