Learn to Code in R: Introduction to R and Basic Concepts.
There are many options when it comes to statistical computing, but R is freely available, powerful, robust, and always getting better. Most statistical software packages have exorbitant costs associated with obtaining personal or group licenses. But with R, you get an extremely powerful software package that is just as good, if not better, for no cost! This software is ever-improving and growing thanks to the many people who contribute to this project and make this all possible.
This post is designed to be a first time exposure to R for those with no experience and want to start learning how to code. Whether you are a student in a stats course trying to learn or are trying to acquire a little R know-how in order to expand you business intelligence skills, this post is designed to help people get started.
In this post, I will be giving you a basic knowledge of R skills so you can start doing simple analyses quickly. Specifically, I will be covering
You can arrange these windows and customize the appearance of Rstudio by going to Tools > Global Options. If you are running OSX, you can also go to Rstudio > Preferences. Go to the Pane Layout tab and arrange the 4 windows as you see fit. You can also go to the Appearance tab on the left to edit the color and font of the IDE. If you stare at screens all day, it may be nice to have a dark colored screen. I won't overwhelm you with options right now so I'll just leave it at that.


This post is designed to be a first time exposure to R for those with no experience and want to start learning how to code. Whether you are a student in a stats course trying to learn or are trying to acquire a little R know-how in order to expand you business intelligence skills, this post is designed to help people get started.
In this post, I will be giving you a basic knowledge of R skills so you can start doing simple analyses quickly. Specifically, I will be covering
- How to acquire R and Rstudio. Rstudio is an IDE (Integrated Development Environment) for R that makes many tasks much easier, such as downloading R libraries.
- Description of Rstudio's 4 window display, and how to customize the appearance of Rstudio.
- Quick discussion of how to use the R console and use an R script file.
- A quick example of entering data and using a function to analyze that data.
- How to access help files and documentation.
Download R and Rstudio
The first thing to do if you haven't already is to download R. This link takes you to a webpage where you can select your operating system. Installation is very straightforward, but if you are on a windows machine and have never installed R before, be aware of the "install R for the first time" link. Once you have R installed, proceed to download Rstudio. Go to the bottom of the page where it says "installers for supported platforms". Choose the installer for your OS and the process is similarly straightforward.Rstudio Display
Once Rstudio is also installed, go ahead and launch it. When it first opens you will see 4 windows. One is the R console as Rstudio connects to R and launches it within the IDE. Second is the Source window, which is where your script files will appear. Third is the "Files, Plots, Packages, Help, Viewer" window. Help documentation, generated plots, and your R libraries will appear here under the various tabs. Last, is the "Environment, History, Connections window." The environment lists out all data objects or stored information you have in your R session. History is just that, a history of code you ran. Lastly the Connections tab is Rstudio helper to connect your Rstudio session to a database using ODBC tools (SQL) or Spark (NoSQL). I have another post that discusses connecting to an SQL database, if that is something you'd like to do. However, You don't need to worry about all these windows for now.You can arrange these windows and customize the appearance of Rstudio by going to Tools > Global Options. If you are running OSX, you can also go to Rstudio > Preferences. Go to the Pane Layout tab and arrange the 4 windows as you see fit. You can also go to the Appearance tab on the left to edit the color and font of the IDE. If you stare at screens all day, it may be nice to have a dark colored screen. I won't overwhelm you with options right now so I'll just leave it at that.
Running R
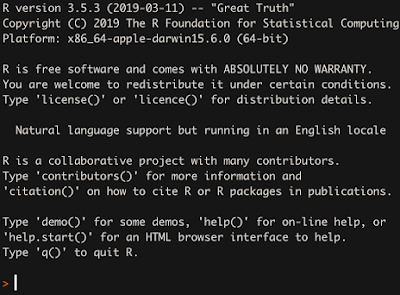
Upon launching, R looks like a blank computer terminal which can be intimidating to people who are accustomed to working with spreadsheets and point-and-click user interfaces. To be honest, it's really not that bad, and by the end of this post you will be able to carry out some simple tasks.
The best way to run R (in my opinion) is to write out your code in and R script and pass that over to the R console. Let's cover that ground by doing a simple task of entering data and getting summary statistics for it. If this is your first time opening R, you'll need to open a new script file by clicking on the plus page icon at the top left and then selecting R script.

Our next task is to enter some data into R and save that data. We'll do that by using the "c()" function, and by using the "save" operator, either "<-" (known as "gets", which is the < and - ) or =. Either will work just fine for this task. I'm going to enter 12 numeric values and save them as a set or a "vector". I will call this vector "obj" for object. You could call it anything really, it doesn't matter. R recognizes functions as any word that is followed by parentheses.
Again, the "c()" is the function that takes the distinct values and makes them a set of values. The parentheses indicate to R that we are calling a function. The output of the function will be saved as the object named "obj". To pass this code from your script file to the console you need only have your cursor on the same line as the code and hit ctrl + return or enter. If you run OSX you can also use command + return or enter.
When you pass this to console it won't do anything other than show the line of code you passed. If you want to see the output, enter the object name into the console and hit return. It will look like my code in the image below. If you do something wrong, you will know as an error message will appear in the console.
The output is displayed in white. All the function did was create a set of values so the output is just that set of values. This is a general principle behind R syntax. That is, feed a function data and save that output as an object. The object "obj" now holds that set of values and we can use them in other functions. Specifically, I will compute summary statistics for these numbers. There is a convenient function called "summary()" that will do this for us.

Notice how the function has the parentheses to start and end, and the data is provided within those parentheses so the functions uses it. Again, this is the general flow of how R works. You get data which is stored as an object by the name of your choosing and pass that data to a function which then uses said data.
Function Documentation
To end things, I want to let you know how to access help documentation so you can start to explore R and use other analytic functions. These files describe functions, how they are used, the syntax behind them, and the output. They often can link you to related functions and topics. To access help documentation just enter a question mark before the name of a function without parentheses into the console, and it will pull up the documentation. For example, I will pull up the help documentation for the summary() function. The code is at the very top left of the graphic.

After doing so, one of the screens of Rstudio will then populate with the help documentation. This will be the window with the five tabs of "Files", "Plots", "Packages", "Help", and "Viewer". By the way, you can arrange the orientation of Rstudio's 4-window layout in Preferences (OSX) or in Tools > Global Options (Windows and OSX). I can't vouch for Linux, but I imagine the setup would be the same as OSX.
When you first start learning to code your brain resists a bit because it is a different way to think about things. If this is a bit hard to wrap your head around at first, be patient. It takes time and practice before writing R code feels more natural.
That concludes this first lesson for people wanting to learn how to code in R. I'm always open to suggestions for future posts so please let me know if there is a topic you would like me to discuss, or something you would like me to explain. Feel free to ask me any specific questions at this site. Be aware that there is a nominal $1.50 fee to submit questions. That is because it takes time and effort to respond to your questions.
Comments
Post a Comment